When a hierarchy or measure is added to the Color drop zone, a corresponding legend is automatically added to the canvas. These legends can be edited , and series editing can also be used to change the colors and fonts in the legend series.
The Legend drop-down in the Component ribbon is used for formatting purposes; to show or hide the legend, to position the legend, and to edit the legend font, borders, and background color.
When working with charts, use the Legend drop down menu (in the Component ribbon) to customize the legend.
- A legend is automatically added to the canvas when a hierarchy or measure is added to the Color drop zone, whether you're working with charts or grids.
- From the Legend drop-down ,the legend can be positioned in four locations on the canvas, the right, left, top, or bottom.
- You can also reposition the legend by dragging and dropping it.
- Show or hide the legend as required (by toggling the Legend button on and off, or by selecting the required option from its drop down menu).
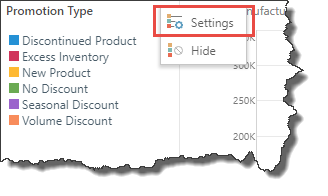
- You can also hide the legend by selecting Hide from its context menu (designated by three ellipses).
- Any customizations made to the legend will be maintained when the visualization is added to presentations and publications.

Discrete Legend Settings
Open the legend panel Settings dialog to change the display settings for the legend. To do this, click the legend's context menu and select Settings.
Legend Settings Dialog

Alignment
Change the alignment of the labels in the legend.
Layout
Auto: when the legend panel is moved to the top or bottom of the canvas, the Number of Columns setting is overridden to automatically display the legend according to the best fit of element labels within the legend panel.
Static Columns: retains the Number of Columns setting when the legend panel is moved to the top or bottom of the canvas.
Wrap: wrap the legend. This option will display only one column.
Columns
By default, legend are displayed with element labels in one column. To change this, enter the number of columns you want displayed in the legend.
Title
Font: change the font type, size, color, and emphasis.
Position: change the position of the title.
- Auto: let Pyramid position the title automatically.
- Horizontal: position the title horizontally along the first line of the legend's elements.
- Top Start: the title will be above the legend's first line of elements, on the left side.
- Top Center: the title will be above the legend's first line of elements, in the middle.
- Top End: the title will be above the legend's first line of elements, on the right side.
- Legacy: apply legacy position from BI Office.
Hide Title: hide the legend title.
Auto Title: enable the auto title, which applies the given measure as the title.
Custom Title: add a custom title.
Continuous Legend Settings
To change the settings for a continuous legend, open its context menu (orange arrow below) and click Settings:

Continuous Legend Settings Dialog

Alignment
Change the alignment of the labels in the legend.
Font
Change the font type, size, color, and emphasis for the legend values.
Format String
Change the format string for the legend values.
Title
The title settings are the same as those explained above.